Explore Other Projects
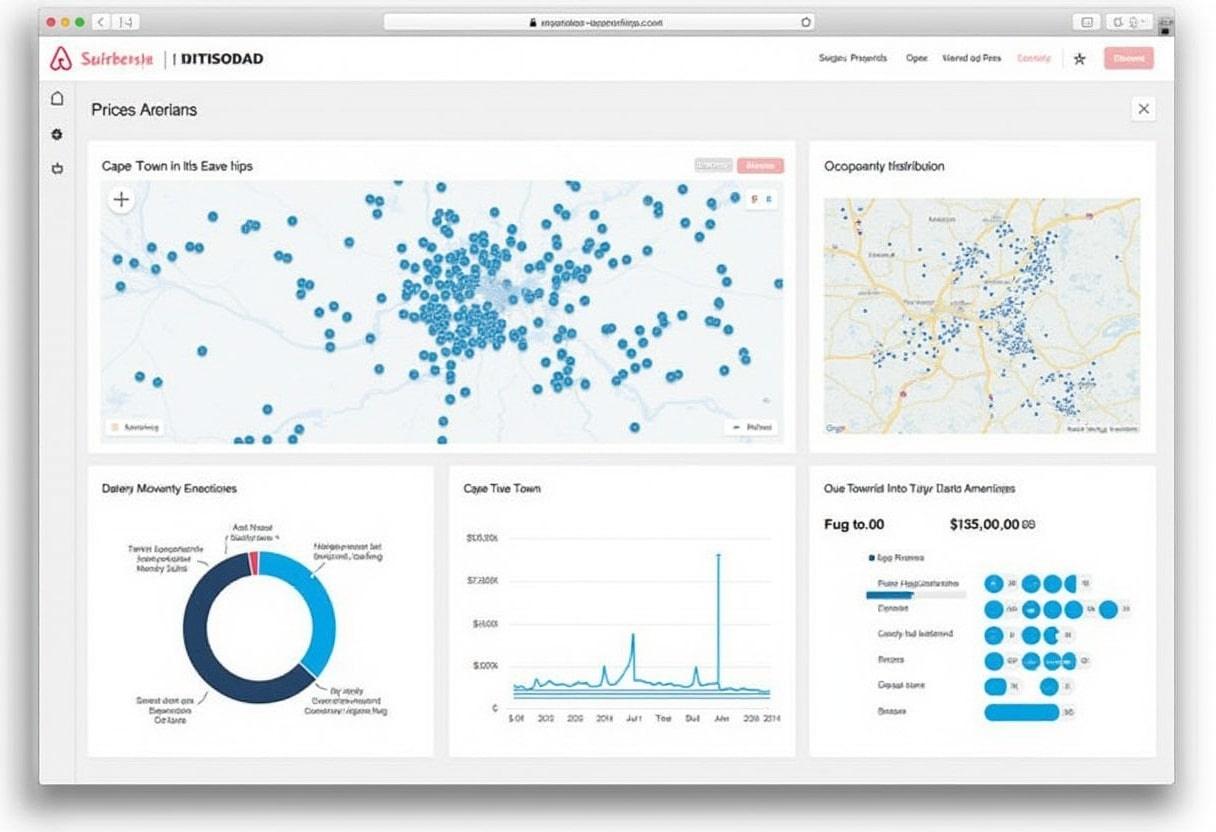
Airbnb Market Analysis
Comprehensive analysis of Cape Town's Airbnb market, identifying pricing trends and investment opportunities.

Customer Churn Analysis
Predictive analytics model to identify at-risk customers and provide targeted retention strategies.

British Airways Service Quality
Analysis of British Airways service quality through customer reviews and operational metrics.